Newton's first law and the Barometer
Some physics lessons arrive in a classroom. Others arrive as a breeze on your shoulder.
Recently, during a trip to Singapore, I had the opportunity to ride the Mass Rapid Transit (MRT). It is an impressively efficient and fully automated transport system. With no drivers in the cabin, passengers in the first coach can look straight through a front window and watch the tracks unfold ahead. I quickly developed a habit of standing there during every ride.
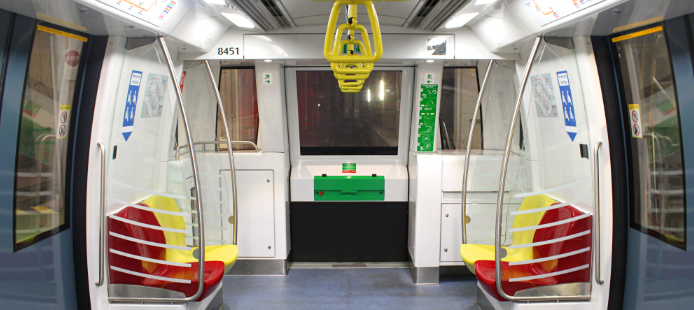 The first cabin in the Singapore MRT with a view to the front
During one such ride, while enjoying the view, I felt a noticeable breeze on the back of my shoulder. At first, I dismissed it as airflow from the air-conditioning system. However, I began to notice a pattern: the breeze appeared only when the train was approaching a station. After several stops, the pattern was unmistakable.
That’s when the physics alarm bell rang in my head. This acceleration-deceleration pattern reminded me of Newton’s first law or the Law of Inertia.
Revisiting Newton’s first law
Isaac Newton’s First Law of Motion, often called the Law of Inertia, states:
An object at rest remains at rest, and an object in motion continues in motion at constant velocity unless acted upon by an external force.
In everyday experience, this is evident when a vehicle brakes and passengers feel a forward lurch. The body was moving with the vehicle and tends to continue moving when the vehicle slows.
Air inside the vehicle behaves no differently.
When the train decelerates, the cabin slows immediately due to braking forces transmitted through the structure. The air inside, possessing mass, tends to continue moving forward. Relative to the cabin, this creates a transient forward shift of air mass.
That shift explains the draft I felt. If the air shifts forward during deceleration, it must accumulate somewhere. In a closed or semi-enclosed space like a train cabin, this forward movement temporarily increases air density and therefore pressure — near the front. This pressure increase should be measurable. And that is where a barometer becomes useful.
A quick note on Helium balloons
This phenomenon reminds me of a well-known demonstration by Destin Sandlin on his Smarter Every Day channel. In his experiment, helium balloons inside a braking car move backward while braking — opposite to what many people intuitively expect.
When the car brakes, the denser air rushes forward due to inertia. The helium balloon, being less dense than air, experiences a buoyant force toward the region of lower pressure — which ends up being toward the rear of the car. The balloon therefore appears to move backward relative to the car. This is a powerful reminder that air has mass, inertia, and measurable dynamic behavior.
Experiment setup on the MRT
To test my MRT train hypothesis, I turned to Phyphox or Physical Phone Experiments, a smartphone application that provides access to raw sensor data. Modern phones contain:
- Accelerometer
- Gyroscope
- Magnetometer
- Barometer
- Microphone
- Light sensor
The barometer, which is what we will be using, measures ambient air pressure with surprising sensitivity. I opened the barometer tool in the app and monitored pressure readings while standing in the first cabin. Over several stops, I observed a gradual pressure increase as the train decelerated approaching a station and a decrease in pressure as the train accelerated away. The plot shows the barometric pressure recorded over approximately 45 seconds, corresponding to a single approach–stop–departure cycle. At the beginning of the trace, the pressure is relatively stable at around 1008 hPa. As the train begins accelerating, the pressure gradually decreases, reaching a minimum of approximately 1006 hPa around 22–24 seconds. Once the train approaches a stop and begins decelerating, the pressure starts to increase.
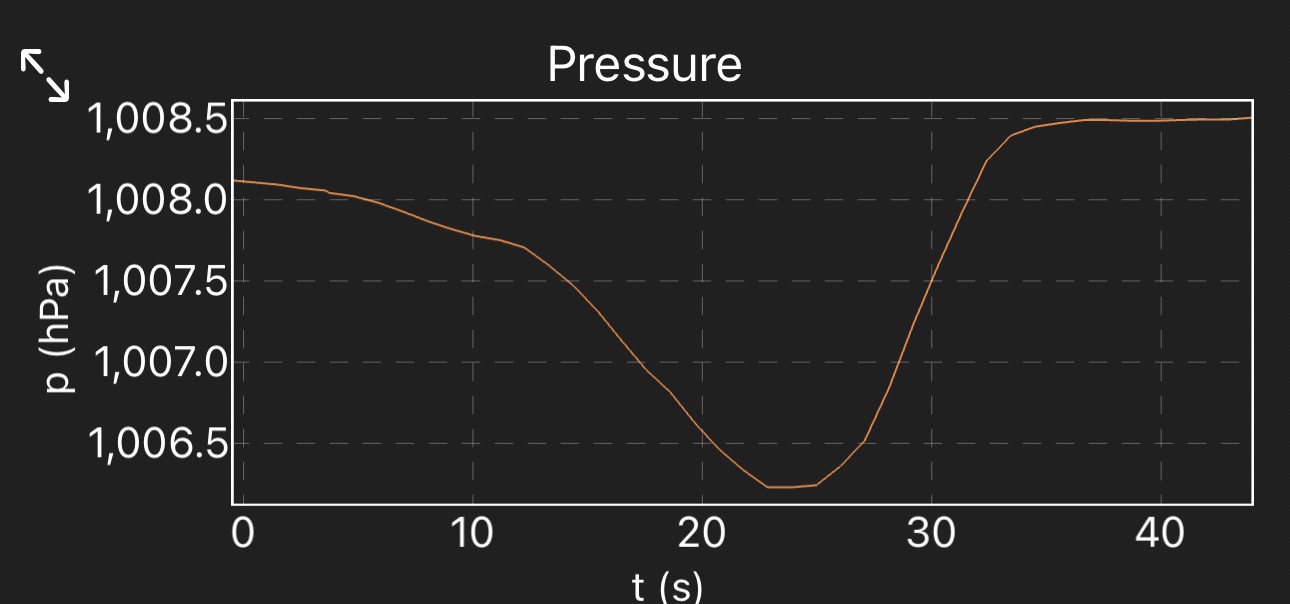 The barometer data showing a fall in pressure due to acceleration and then rise due to deceleration
The second figure below shows a longer time window spanning several minutes of travel. Each dip and rise corresponds to successive station stops. The repeating pattern is clearly visible. A pressure decrease during accceleration, a partial recovery or overshoot during deceleration and a relatively flat segment during constant velocity travel between stations.
The periodic nature of the signal confirms that the variations are not random environmental fluctuations. Instead, they are correlated with the train’s motion profile. From this broader trace, one can count the number of station stops, identify dwell time at stations (flat segments) and distinguish between acceleration and braking phases. The pressure signal effectively becomes a proxy for the train’s motion.
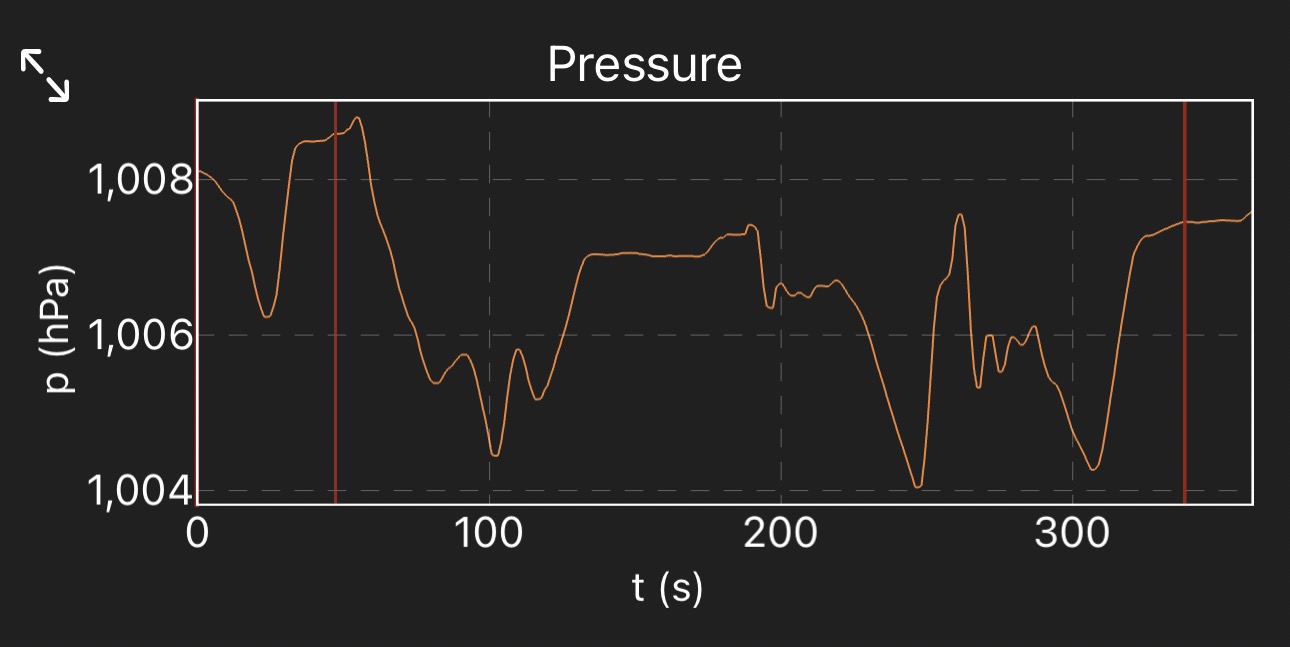 The troughs and crests in the pressure data showing the stops that the train made
Sadly, I forgot to record the accelerometer data to show that this phenomenon indeed happened only when the train accelerated and decelerated. But even without accelerometer data for that first run, the correlation with station stops was clear.
This confirmed the hypothesis: the breeze I felt was due to air inertia, and the pressure changes were measurable evidence of Newton’s First Law in action.
Connecting this to previous experiments
This experiment builds directly on earlier investigations documented in one of my previous articles. I highly recommend you check it out.
In that article, I explored the relationship between altitude and atmospheric pressure using barometric measurements during flight. That analysis examined how pressure varies systematically with height and how smartphone sensors can capture that relationship with surprising accuracy.
In another experiment, I explored unconventional uses of smartphone sensors — extracting physiological signals such as heart rate.
Repeating the Experiment — This Time in an Aircraft
Later in the trip, I had another opportunity to repeat the experiment — this time aboard an Airbus A350, I prepared more carefully.
Barometer recording: ON
Accelerometer recording: ON
I was seated toward the rear of the aircraft during taxi and takeoff and during the takeoff roll.
The first figure shows the barometric pressure recorded from inside the aircraft cabin over approximately four minutes, spanning the taxi phase, takeoff roll, and initial climb. At the beginning of the trace, the pressure is relatively stable around 950–952 hPa, corresponding to the cabin pressure while the aircraft is still on the ground. During the early portion of the recording, there is a slight increase in pressure, reaching a local maximum of roughly 960 hPa. This region corresponds to the takeoff roll, when the aircraft is accelerating along the runway.
This temporary rise in pressure is consistent with inertial effects inside the cabin. As the aircraft accelerates forward, the cabin structure responds immediately to engine thrust, but the air inside possesses inertia. Relative to the accelerating frame of the aircraft, the air lags slightly, establishing a longitudinal pressure gradient within the cabin. Depending on the location of the sensor along the cabin length, this redistribution can appear as a measurable pressure increase or decrease. The key observation is that the pressure variation coincides with the phase of strongest acceleration.
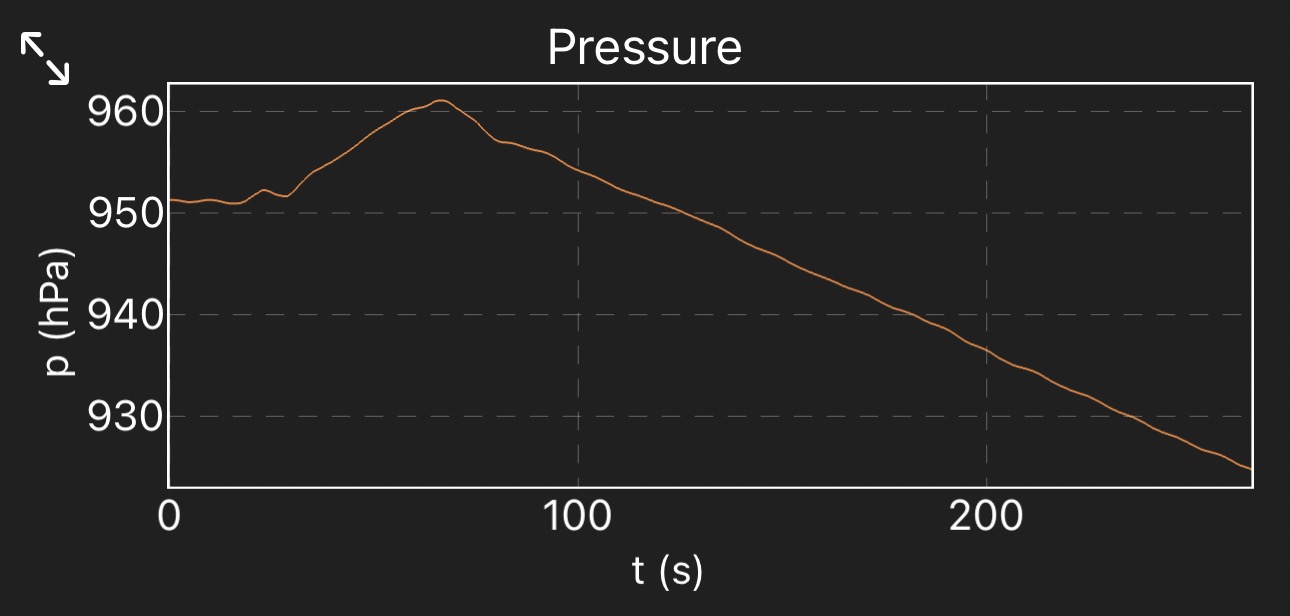 Aircraft pressure data showing an initial rise due to acceleration and then a drop due to altitude
After liftoff, the pressure trace changes character entirely. Instead of short-term fluctuations, the curve begins a steady downward trend. This marks the start of the climb phase. As the aircraft gains altitude, the outside atmospheric pressure decreases according to the well-known barometric relationship between pressure and height. Although the cabin is pressurized, it is not held at sea-level pressure; instead, it follows a controlled schedule that allows cabin pressure to decrease gradually as altitude increases. The smooth, continuous decline in the graph reflects this controlled cabin pressurization profile during climb. Again, this altitude-pressure phenomenon is documented in detail in one of my previous blog posts.
The second figure shows the corresponding accelerometer data along two axes during the same time interval. The acceleration trace reveals a clear increase during the takeoff roll. In the forward axis, the signal rises as thrust builds and the aircraft accelerates down the runway. The vertical axis shows fluctuations associated with vibration, runway irregularities, and eventually the transition to flight. Once airborne and in steady climb, the accelerations settle into a more stable profile dominated primarily by gravitational acceleration and small perturbations from turbulence.
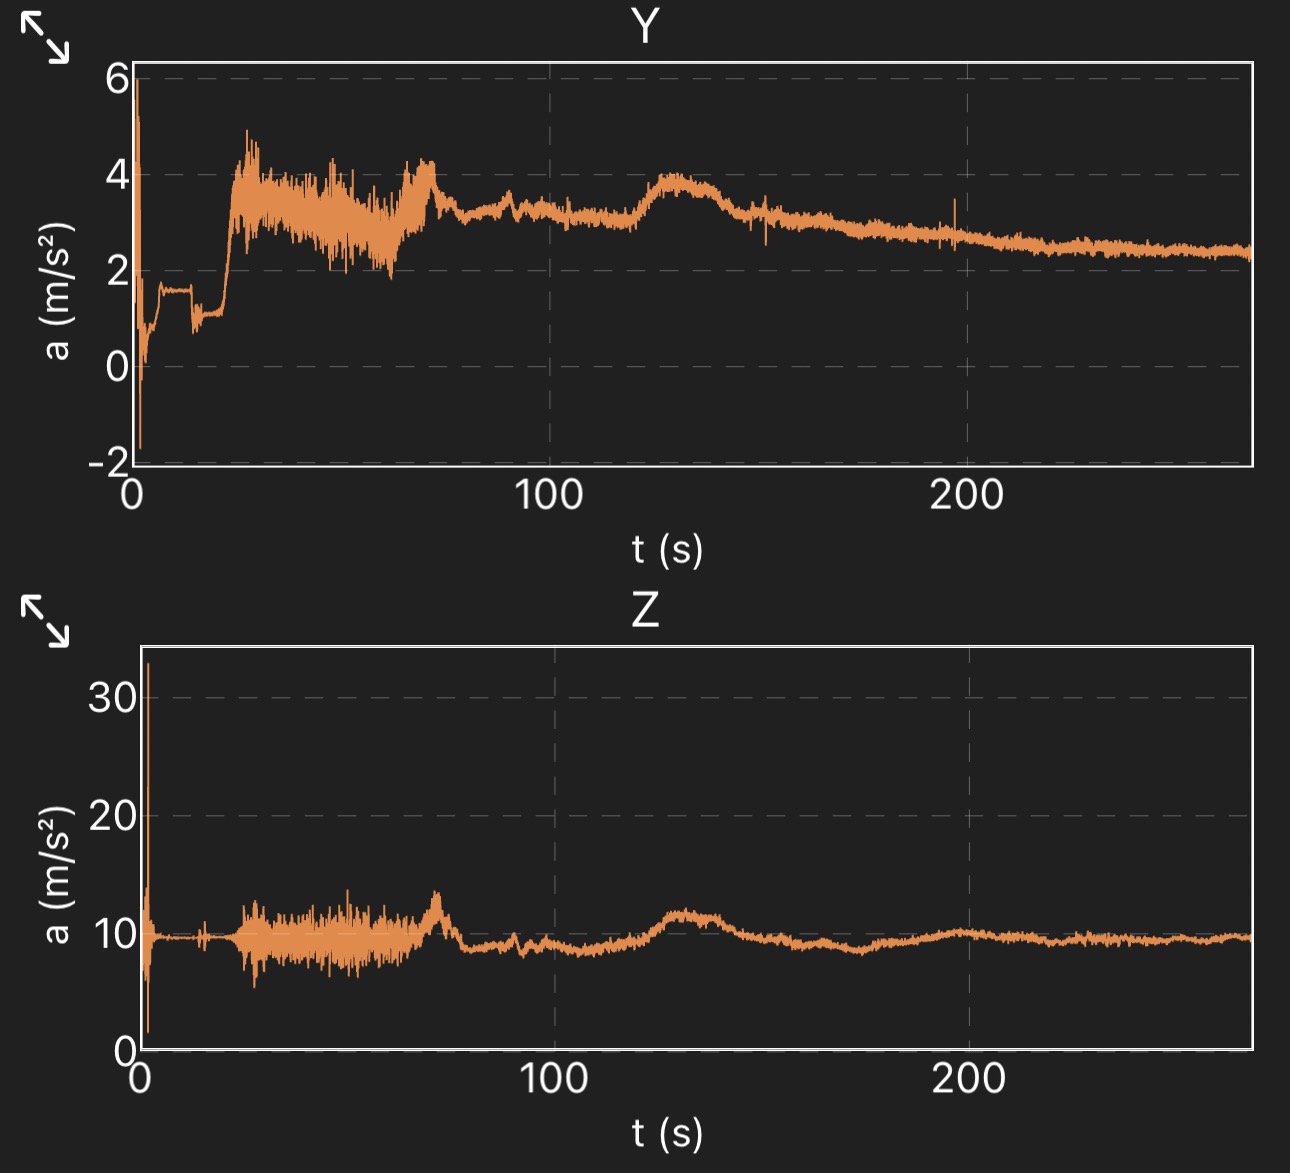 Aircraft acceleration data showing the forces during takeoff roll
When the pressure and acceleration data are considered together, a clear correlation emerges. The local rise in pressure occurs during the same time window as the strongest forward acceleration. This supports the interpretation that the initial pressure variation is driven by inertial redistribution of air within the cabin. After acceleration stabilizes and climb begins, the dominant effect on the barometer is no longer inertia but altitude gain, leading to the gradual pressure decrease seen in the remainder of the trace.
In a single experiment, these measurements capture two distinct physical phenomena. The short-term pressure change reflects Newton’s First Law acting on a confined air mass inside an accelerating reference frame. The long-term pressure decline reflects the thermodynamic structure of Earth’s atmosphere and the aircraft’s controlled pressurization system.
Seeing the Familiar Differently
What I value most in moments like these is not the data itself, but the realization that follows. Newton’s First Law is often introduced through idealized diagrams — blocks sliding on frictionless surfaces, arrows neatly indicating forces, motion represented by perfectly straight lines. These abstractions are useful, but dont explain the theory clearly.
In reality, physics operates continuously in the background of everyday life. It is present in the faint breeze felt while a train slows into a station. It is visible in the counterintuitive motion of a helium balloon inside a braking car. It appears in the subtle pressure variations recorded inside a pressurized aircraft cabin during takeoff. These are not separate curiosities; they are different manifestations of the same fundamental principle — inertia acting on matter, whether solid or gaseous.
In summary, a simple sensory observation led to a testable hypothesis. That hypothesis was examined using accessible instrumentation like the smartphone barometer. The resulting data confirmed that even small-scale inertial effects inside vehicles can be quantified. The broader conclusion is straightforward: fundamental physical laws are not distant or abstract. They are embedded in ordinary experiences, waiting to be recognized.
Sometimes, noticing them requires nothing more than curiosity — and a barometer in your pocket.